Australia emerged as the leading destination for Papua’s exports in July 2026, accounting for 68.39% of the province’s total overseas shipments, according to Indonesia’s Central Statistics Agency (BPS). The figures underline the importance of Australia to Papua’s external trade, even as the province’s overall export value fell sharply from the previous month.
Papua recorded exports worth US$3.82 million in July, with shipments to Australia valued at approximately US$2.61 million. Papua New Guinea and New Zealand followed, accounting for 12% and 10.29% of exports, respectively. BPS Papua reported the figures, and ANTARA published them on October 2, 2026.
The data offer a snapshot of Papua’s place in the regional economy. Its proximity to Australia and other Pacific markets gives the province potential access to international trade routes. But the July figures also reveal a gap between where goods are produced and where they are shipped, with most of the province’s exports passing through a major port outside Papua.
Australia Takes the Largest Share
Three Markets Account for Most Shipments
BPS Papua’s acting provincial head, Akhmad Jaelani, said Australia was the largest destination for Papua’s exports in July, followed by Papua New Guinea and New Zealand.
Australia received goods worth US$2.61 million, equivalent to 68.39% of total exports. Papua New Guinea accounted for US$458,230, or 12%, while New Zealand received US$392,710, or 10.29%.
Together, the three destinations represented the overwhelming majority of Papua’s overseas trade for the month. Their combined share illustrates the significance of nearby markets in the province’s export geography.
For Papua, the figures are relevant beyond the immediate value of trade. Export relationships can connect local production to overseas demand, create commercial opportunities, and encourage improvements in transport and logistics. However, the July data alone do not establish how much income reached local producers or how many jobs were generated.
Monthly Exports Fall by 45.8%
Despite Australia’s leading position, Papua’s total exports declined by 45.8% compared with June 2026, when the province recorded US$7.04 million in shipments.
The decrease is an important qualification to the headline figure. Australia’s large share does not mean that exports were expanding overall. Rather, it shows how the province’s remaining trade was distributed among its principal overseas destinations during a month when total export value was substantially lower.
The figures also emphasize the importance of interpreting monthly trade data within its context. A single month can reflect changes in shipment schedules, the timing of large consignments, and variations in demand. The published report does not identify the specific reasons for July’s decline, so attributing it to any one factor would go beyond the available evidence.
Timber Products Dominate Papua’s Exports
Non-Oil and Gas Goods Account for Almost All Shipments
The composition of Papua’s exports was particularly concentrated in non-oil and gas products. These accounted for 99.87% of the province’s July exports, valued at approximately US$3.81 million. Oil and gas contributed just 0.13%, or US$4,910.
Wood and articles of wood, classified under HS44, were the largest non-oil and gas export category. They were valued at US$3.36 million, making them the dominant commodity group in the month’s figures.
The concentration in wood products is a defining feature of the July trade report. It also raises questions about the resilience and breadth of Papua’s export base. A province whose overseas shipments depend heavily on a narrow range of goods may be more exposed to changes in demand, prices, regulations, and transport expenses affecting those products.
The available figures do not provide a detailed breakdown of the wood category by product, company, production location, or destination. They therefore cannot establish how much of the trade came from particular districts or how benefits were distributed among communities.
A Question of Value Beyond Raw Shipments
For Papua’s economy, the long-term significance of exports depends not only on the value recorded at the border but also on the economic activity associated with production and processing.
Processing capacity, workforce development, reliable electricity, transport infrastructure, and access to finance can all influence how much value remains in a region. These are broader economic considerations rather than outcomes demonstrated by the July figures themselves.
The data nevertheless provide a useful reference point for discussions about diversification. Expanding the range of competitive products, where economically and environmentally viable, could reduce dependence on a limited number of commodity groups and help broaden Papua’s participation in international trade.
The Logistics Challenge Behind the Numbers
Most Exports Are Shipped Through Surabaya
One of the most striking details in the BPS report concerns the ports used to load Papua’s exports.
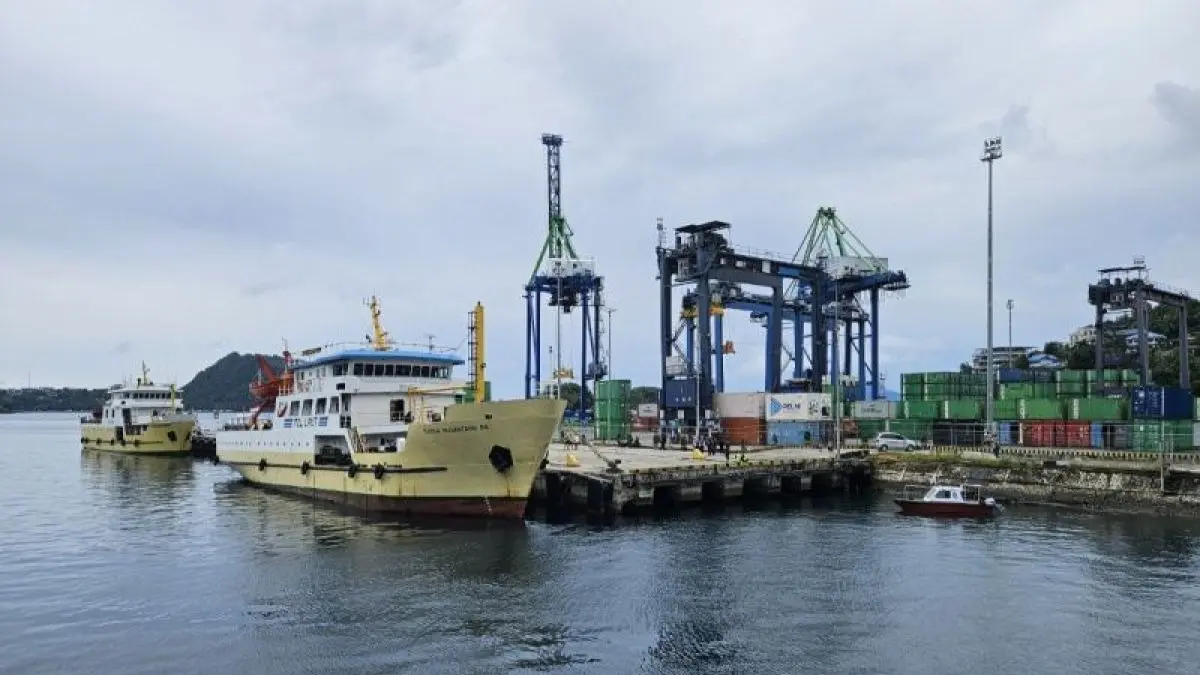
Only US$458,230, equivalent to 12% of the province’s July exports, was loaded directly through Jayapura Port. By contrast, US$3.36 million, or 87.99%, was shipped through Tanjung Perak Port in Surabaya, East Java.
The figures indicate that the province’s export activity remains closely connected to logistics infrastructure outside Papua. Even when goods originate in the region, their route to overseas markets may involve additional handling and transport through another Indonesian port.
This arrangement is an important part of the context for understanding Papua’s trade performance. Export competitiveness depends not only on the quality and price of goods but also on the time, cost, and reliability of moving them from production sites to international buyers.
The report does not quantify the additional costs associated with routing shipments through Surabaya, nor does it compare the efficiency of alternative routes. Still, the port figures identify logistics as a relevant issue for future economic planning.
Jayapura’s Role in Regional Connectivity
Jayapura’s direct export activity demonstrates that the province already has a port serving international trade. Its location also places it within the wider geography of the Pacific, where commercial links with Australia, Papua New Guinea, and New Zealand are particularly relevant.
Strengthening the role of local ports would require more than increasing the number of shipments. It would depend on dependable shipping services, cargo-handling capacity, customs procedures, storage facilities, and connections between ports and production areas.
For businesses, predictable delivery schedules can be as important as freight prices. For producers, delays and uncertain transport arrangements can affect the ability to meet contracts and maintain relationships with overseas buyers.
The July figures do not reveal any plans for changes in port infrastructure or the speed at which such changes could occur. They do, however, provide a measurable starting point for assessing the province’s current export routes.
Papua’s Wider Trade Position
January to July Exports Reach US$35.8 Million
Over the first seven months of 2026, Papua recorded cumulative exports of approximately US$35.80 million, according to the figures cited in the September 2 report published by Koran Jakarta.
The cumulative total provides a broader view than July alone. It places the month’s decline within a longer reporting period and offers a baseline for future comparisons.
However, the published figures supplied here do not include a complete month-by-month breakdown of the January-to-July total, nor do they establish whether the year-to-date result is higher or lower than the same period in 2025. Those comparisons would be needed to assess the direction of Papua’s export performance over a longer period.
The distinction is relevant for policymakers and businesses. A fall in one month does not necessarily indicate a sustained downturn, just as a strong monthly result does not guarantee long-term growth.
What the Figures Mean for Papua and Its Neighbors
Papua’s export relationship with Australia is part of a wider pattern of economic connections across the Pacific. The presence of Papua New Guinea and New Zealand among the province’s leading destinations further illustrates the importance of nearby international markets.
For Papua, these connections may offer opportunities to strengthen commercial ties and improve the movement of goods across the region. Yet trade growth is not automatic. It depends on the ability of producers to meet market requirements, maintain consistent supply, and compete on quality, price, and delivery.
There is also a difference between export concentration by destination and export concentration by product. In July, Australia accounted for the largest share of shipments by destination, while wood products dominated the commodity mix. Both patterns are relevant, but they describe different aspects of the province’s trade exposure.
A more complete assessment would require additional information, including the value of exports by company and district, employment associated with production, local processing levels, and the share of revenue retained in Papua. Without those details, the export figures should be treated as an important economic indicator rather than a complete measure of local prosperity.
Conclusion
Australia’s position as Papua’s leading export destination in July 2026 highlights the province’s connection to nearby international markets. With 68.39% of exports directed to Australia and wood products accounting for the largest share of shipments, the data show both the scale and the concentration of Papua’s current trade.
The decline in total exports from June and the heavy use of Surabaya for outbound shipments also point to questions that will matter in the months ahead. These include the stability of demand, the diversity of products, the cost of logistics, and the capacity of local infrastructure to support exporters.
The next stage of Papua’s trade development will depend on whether market access can be translated into more reliable supply chains and broader economic participation. Better data on production, employment, and local value creation would help determine how much the province benefits from its overseas trade.
For now, the July report offers a clear finding: Australia was Papua’s largest export market, but the longer-term economic significance of that relationship will depend on what happens beyond the monthly figures.
Read Also
Papua Tengah’s Crab Exports Open New Coastal Market
Papua Tengah Launches First Seafood Export